Free Access
Fig. 6
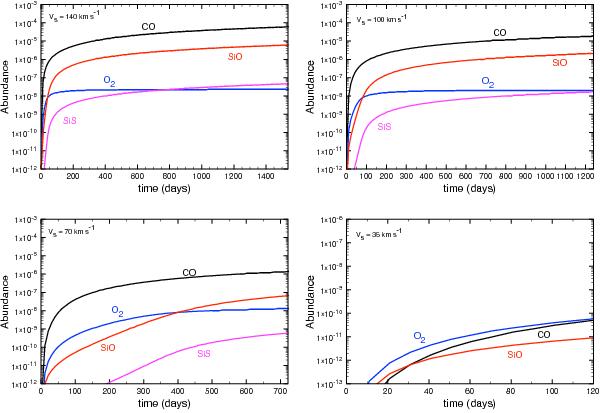
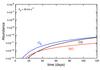
Abundances of molecules in the PIR (with respect to total gas number density) for various shock velocities. Top left: 140 km s-1. Top right: 100 km s-1. Bottom left: 70 km s-1. Bottom right: 35 km s-1. All shock models are from BS90.
This figure is made of several images, please see below:
Current usage metrics show cumulative count of Article Views (full-text article views including HTML views, PDF and ePub downloads, according to the available data) and Abstracts Views on Vision4Press platform.
Data correspond to usage on the plateform after 2015. The current usage metrics is available 48-96 hours after online publication and is updated daily on week days.
Initial download of the metrics may take a while.