Fig. 5
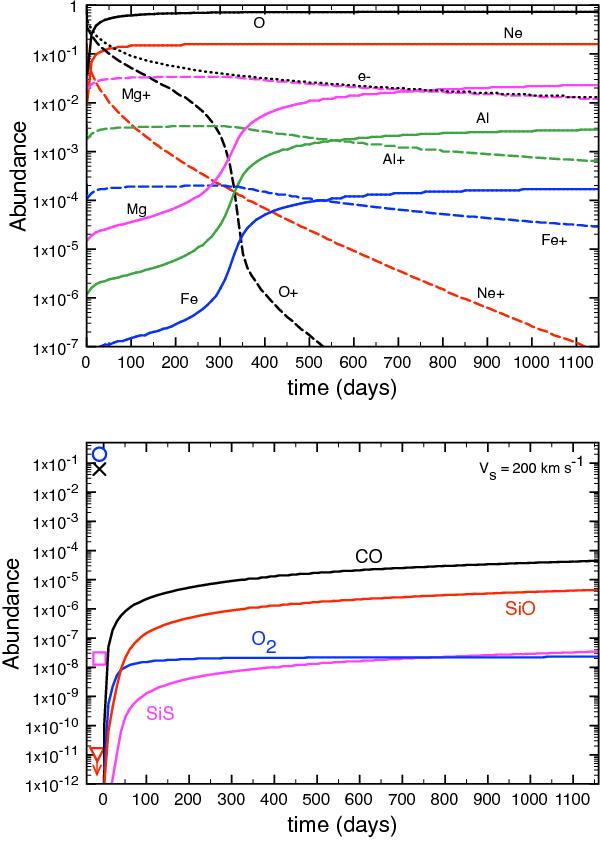
Abundances in the PIR (with respect to total gas number density) for the 200 km s-1 shock model. Top: ions and atoms. Bottom: molecules. Abundances in the pre-shock gas are those derived from Sect. 4.1.2 at 3000 days post-explosion and for a density increase x = 200. They are plotted as symbols at t = 0 (blue circle: O2; black cross CO; pink square: SiS; red triangle: SiO). The SiO pre-shock abundance value is 1 × 10-17.
Current usage metrics show cumulative count of Article Views (full-text article views including HTML views, PDF and ePub downloads, according to the available data) and Abstracts Views on Vision4Press platform.
Data correspond to usage on the plateform after 2015. The current usage metrics is available 48-96 hours after online publication and is updated daily on week days.
Initial download of the metrics may take a while.