Fig. 1
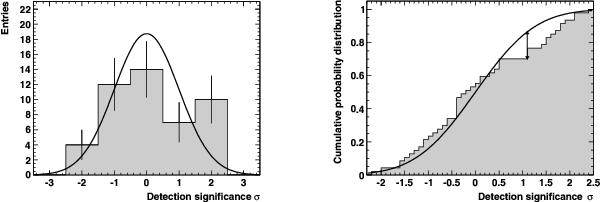
Left: distribution of the detection significances, σ, for the 47 candidates using 1σ-wide bins. Error bars indicate the square root of the number of events in each bin, and the black line is a normal distribution of 47 events centered on zero and of unit width. Right: cumulative distribution function of the detection significance and of the normal distribution. The maximum distance between the distributions is shown as a double-headed arrow.
Current usage metrics show cumulative count of Article Views (full-text article views including HTML views, PDF and ePub downloads, according to the available data) and Abstracts Views on Vision4Press platform.
Data correspond to usage on the plateform after 2015. The current usage metrics is available 48-96 hours after online publication and is updated daily on week days.
Initial download of the metrics may take a while.