Fig. 6
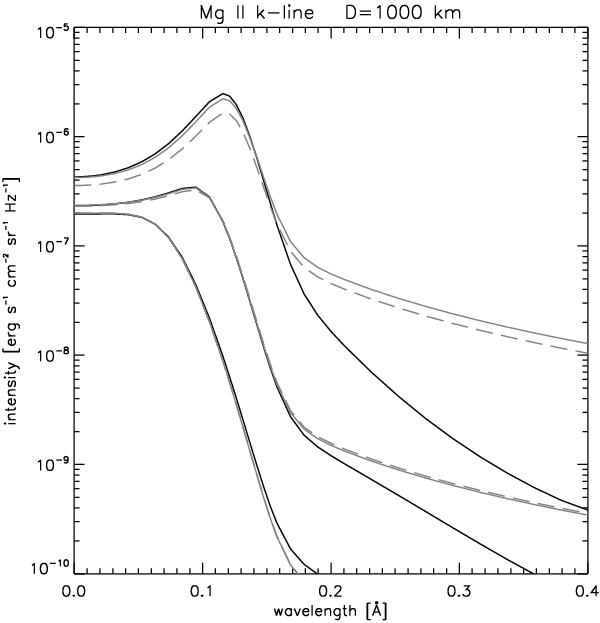
Comparison between PRD and CRD profiles for D = 1000 km and T = 8000 K. Profiles with increasing intensity correspond to increasing gas pressures p = 0.001,0.1, and 0.5 dyne cm-2. Black profiles correspond to PRD and gray ones to CRD having enhanced wings. For hydrogen, which determines the electron density, the PRD approach was used for Lyman α and Lyman β lines. The gray dash then shows the effect of using CRD for both hydrogen and Mg ii.
Current usage metrics show cumulative count of Article Views (full-text article views including HTML views, PDF and ePub downloads, according to the available data) and Abstracts Views on Vision4Press platform.
Data correspond to usage on the plateform after 2015. The current usage metrics is available 48-96 hours after online publication and is updated daily on week days.
Initial download of the metrics may take a while.