Fig. 7
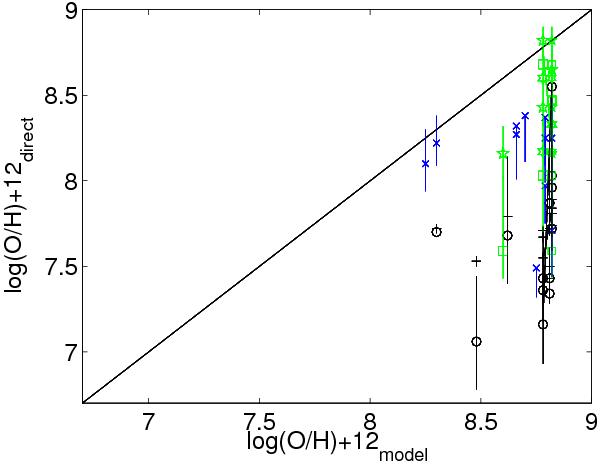
O/H calculated with the direct method and other empirical methods versus O/H calculated by detailed modelling. From Kakazu et al.: black circles (direct method); black pluses (Yin et al. method). From Xia et al.: blue crosses (calibration); green symbols refer to the Henry et al. data: large symbols result from AGN models (see text). The solid line represents the 1:1 line.
Current usage metrics show cumulative count of Article Views (full-text article views including HTML views, PDF and ePub downloads, according to the available data) and Abstracts Views on Vision4Press platform.
Data correspond to usage on the plateform after 2015. The current usage metrics is available 48-96 hours after online publication and is updated daily on week days.
Initial download of the metrics may take a while.