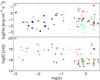
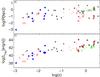
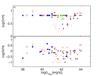
Fig. 5
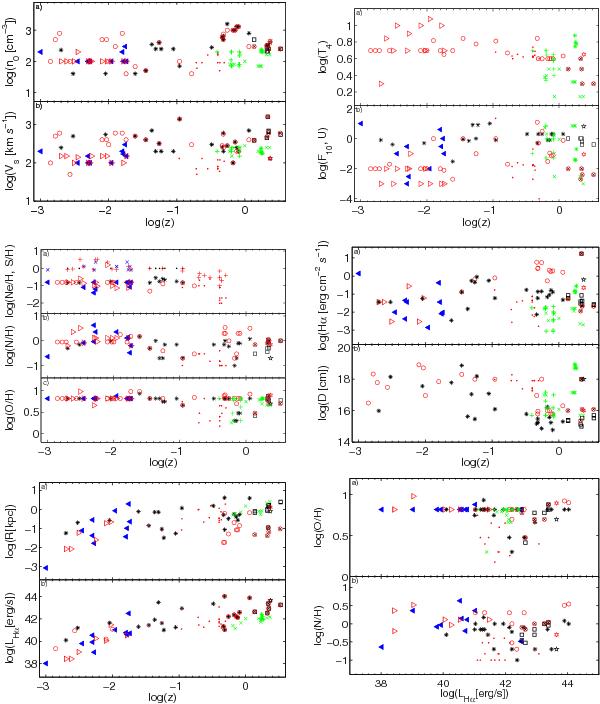
Evolution of different parameters with z (adapted from Paper I, Fig. 3). Top left: n0 and Vs; top right: the radiation parameters F (in units of 1010 photons cm-2 s-1 eV-1 at the Lyman limit), the ionization parameter U, and the temperature of the stars (in units of 104 K); middle left: the relative abundances in units of 10-4; middle right: Hαcalc and D; bottom left: the radius R (in kpc) of the NLR in AGN and of the emission regions in SBs and the Hα luminosity (LHα): bottom right: the metallicity versus LHα. Symbols: green pluses, green crosses, and green asterisks refer to the Kakazu et al., Xia et al., and Henry et al. samples, respectively. Red circles represent SB galaxies (Viegas et al. 1999; Contini 2013a; Ramos Almeida et al. 2013; Capetti et al. 2013; Winter et al. 2010); red circles around a cross refer to the SBs in the optically faint ULIRGs (Brand et al. 2007); red triangles: SB galaxies in the LINER sample (Contini 1997); red dots: HII regions in star forming galaxies (Kobulnicky & Zaritsky 1999); red hexagram: ULIRG in QSO 2222-0964 (Krogager et al. 2013); black asterisks: the AGNs (Ramos Almeida et al. 2013; Contini 2013a; Schirmer et al. 2013; Winter et al. 2010); black squares refer to the optically faint ULIRGs (Brand et al. 2007); blue filled triangles: the AGNs belonging to the LINER sample (Contini 1997); black pentagram: ULIRGs (Krogager et al. 2013). For Ne/H. Red pluses: SB; blue crosses: LINER AGN; black dots: AGN.
Current usage metrics show cumulative count of Article Views (full-text article views including HTML views, PDF and ePub downloads, according to the available data) and Abstracts Views on Vision4Press platform.
Data correspond to usage on the plateform after 2015. The current usage metrics is available 48-96 hours after online publication and is updated daily on week days.
Initial download of the metrics may take a while.