Fig. 13
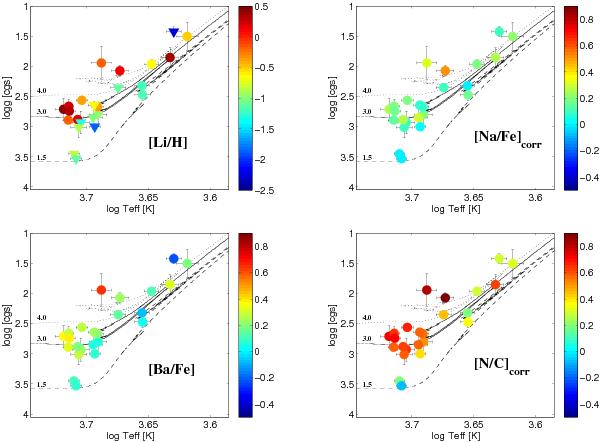
Variations of some key abundance ratios across the log Teff–log g plane. For the NLTE lithium abundances, the downward-pointing triangles denote upper limits. The predictions at solar metallicity of evolutionary models for masses of 1.5, 3, and 4 M⊙ are overplotted for illustrative purposes. Same tracks as in Fig. 1, except that the evolutionary phase, is not colour coded.


Current usage metrics show cumulative count of Article Views (full-text article views including HTML views, PDF and ePub downloads, according to the available data) and Abstracts Views on Vision4Press platform.
Data correspond to usage on the plateform after 2015. The current usage metrics is available 48-96 hours after online publication and is updated daily on week days.
Initial download of the metrics may take a while.