Fig. 7
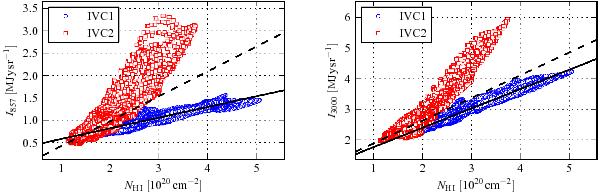
H i-FIR correlations for IVC 1 and IVC 2 at 857 GHz (left) and 3000 GHz (right). The H i is integrated between −100 km s-1 ≤ vLSR ≤ + 100 km s-1. The black solid line is the linear fit applying Eq. (1)for IVC 1 and the dashed black line for IVC 2. For IVC 2 the fit is restricted to NH i ≤ 2.0 × 1020 cm-2, above which a FIR excess due to H2 is evident. For IVC 2 the spread in NH i for given Iν is due to a second FIR maximum that is not associated with an H i peak (Fig. 12).
Current usage metrics show cumulative count of Article Views (full-text article views including HTML views, PDF and ePub downloads, according to the available data) and Abstracts Views on Vision4Press platform.
Data correspond to usage on the plateform after 2015. The current usage metrics is available 48-96 hours after online publication and is updated daily on week days.
Initial download of the metrics may take a while.