Fig. 4
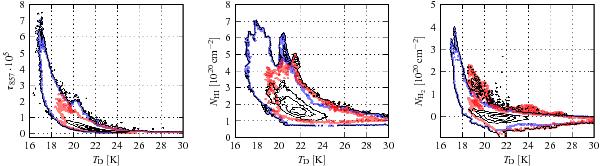
Dependence of dust optical depth τ857 (left), H i column density NH i (middle), and H2 column density NH2 (right) on dust temperature TD. The TD − τ857 plot is done for FIR data at the resolution of the 353 GHz data while the other two plots are for FIR data smoothed to the EBHIS resolution. The black contours show the number density distribution of all data points. The blue contour traces the pixels that contain more H i between −20 km s-1 ≤ vLSR ≤ +20 km s-1 than in the IVC range −60 km s-1 ≤ vLSR ≤ −20 km s-1, whereas the red contour traces pixels that have more H i in the IVC regime. In Sect. 4.3 we describe how we derive an H2 map from the FIR excess emission. Negative NH2 are a result of the derivation.
Current usage metrics show cumulative count of Article Views (full-text article views including HTML views, PDF and ePub downloads, according to the available data) and Abstracts Views on Vision4Press platform.
Data correspond to usage on the plateform after 2015. The current usage metrics is available 48-96 hours after online publication and is updated daily on week days.
Initial download of the metrics may take a while.