Fig. 2
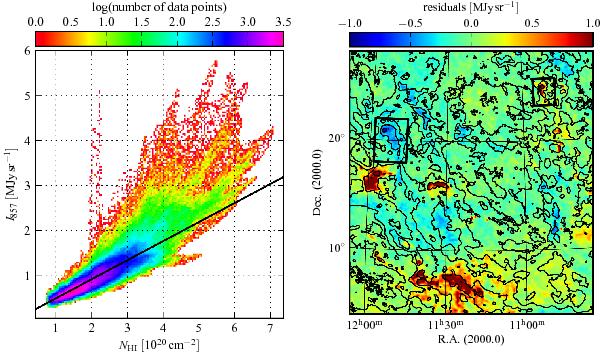
Left: correlation plot NH i vs. 857 GHz for the entire field. The black solid line is our best fit of Eq. (1)to the data below NH i = 2 × 1020 cm-2. Right: residual map at 857 GHz. The residuals are derived by subtracting for each pixel the FIR sky brightness calculated from Eq. (1)using the linear-fit parameters. The black contours denote NH i as in Fig. 1. The black rectangles mark the locations of two H i clouds (IVC 1 on the left, IVC 2 on the right) which are presented in more detail in Sect. 5.
Current usage metrics show cumulative count of Article Views (full-text article views including HTML views, PDF and ePub downloads, according to the available data) and Abstracts Views on Vision4Press platform.
Data correspond to usage on the plateform after 2015. The current usage metrics is available 48-96 hours after online publication and is updated daily on week days.
Initial download of the metrics may take a while.