Fig. 13
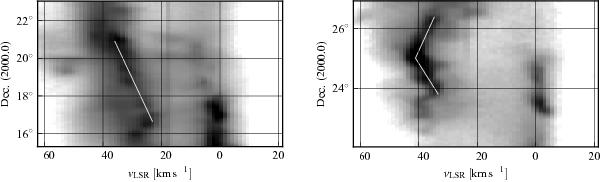
Position–velocity (PV) diagrams of IVC 1 (left) integrated between 11h57m ≥ RA ≥ 11h45m and IVC 2 (right) integrated between 10h54m ≥ RA ≥ 10h48m. The white lines indicate the orientation of the IVCs in PV space showing a velocity gradient which is interpreted as evidence for interactions of the clouds with the surrounding medium.
Current usage metrics show cumulative count of Article Views (full-text article views including HTML views, PDF and ePub downloads, according to the available data) and Abstracts Views on Vision4Press platform.
Data correspond to usage on the plateform after 2015. The current usage metrics is available 48-96 hours after online publication and is updated daily on week days.
Initial download of the metrics may take a while.