Fig. 5
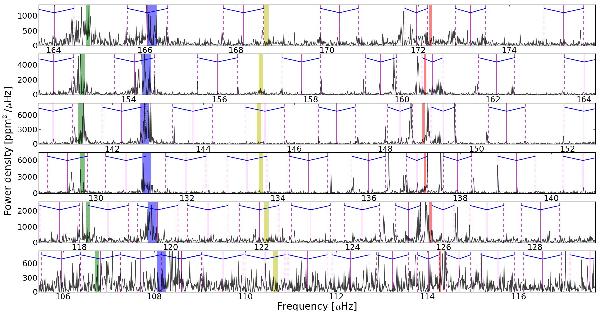
Power density spectrum (PDS) of KIC 5006817 (Q0–Q13). Each panel contains one radial order. Mode identifications of the pure p modes come from the universal frequency pattern (Mosser et al. 2011b) for ℓ = 0, 1, 2 and 3 and are indicated with blue, red, green and yellow vertical bars, respectively. The effects of rotation are visible as the splitting of dipole modes, located in the centre of each panel. The observed PDS is overlaid with the theoretical frequencies of mixed dipole modes (m = 0, solid thin lines) and the theoretical frequencies of the rotationally split components (m = ± 1, dashed thin lines) which have been calculated using methods described by Mosser et al. (2012a,b). The components belonging to one rotationally split multiplet are indicated through V-markers at the top of each panel.
Current usage metrics show cumulative count of Article Views (full-text article views including HTML views, PDF and ePub downloads, according to the available data) and Abstracts Views on Vision4Press platform.
Data correspond to usage on the plateform after 2015. The current usage metrics is available 48-96 hours after online publication and is updated daily on week days.
Initial download of the metrics may take a while.