Fig. 3
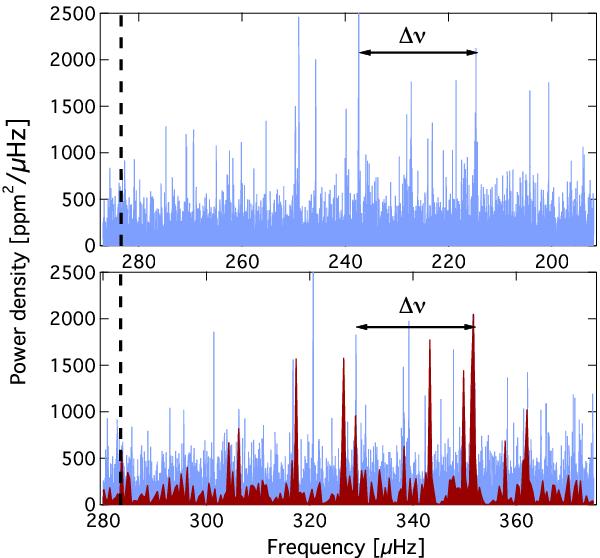
Power density spectra of KIC 8803882 from 1250 d of long and 30 d of short cadence data are shown in blue and red, respectively. The formal Nyquist frequency (dashed line) separates the reflected oscillation power (top panel, sub-Nyquist frequency range) and the original power excess (bottom panel, super-Nyquist frequency range).
Current usage metrics show cumulative count of Article Views (full-text article views including HTML views, PDF and ePub downloads, according to the available data) and Abstracts Views on Vision4Press platform.
Data correspond to usage on the plateform after 2015. The current usage metrics is available 48-96 hours after online publication and is updated daily on week days.
Initial download of the metrics may take a while.