Fig. 2
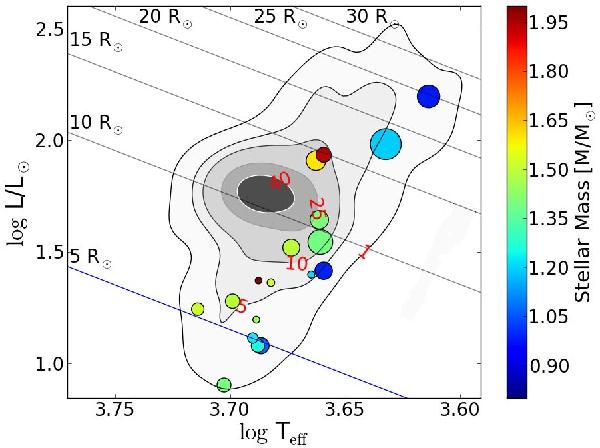
Position of the 18 red giant heartbeat stars from Tables 1 and 2 in the HR diagram, where the colour shows the mass of the red giant, derived from seismology. The size of the dots represents the orbital period, ranging between 20 and 438 d. The contour surfaces reflect the density distribution of 1000 pulsating red giants. The darkest areas mark the position of the densely populated red clump. Numbers in red indicate the star count per bin, for which the contour surfaces have been drawn. Lines of equal radii in the HR diagram have been drawn for selected stellar radii between 5 and 30 R⊙.
Current usage metrics show cumulative count of Article Views (full-text article views including HTML views, PDF and ePub downloads, according to the available data) and Abstracts Views on Vision4Press platform.
Data correspond to usage on the plateform after 2015. The current usage metrics is available 48-96 hours after online publication and is updated daily on week days.
Initial download of the metrics may take a while.