Fig. 16
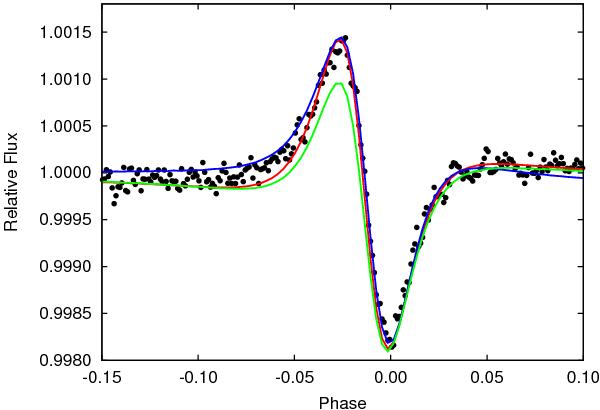
Comparison between the data (grey points), the best-fit light curve model without beaming (dotted red line), the best-fit model with beaming (dashed blue line), and the best-fit model for an imposed orbital inclination of 76°, as determined through asteroseismology (solid green line). A change in the inclination changes the ratio between the maximum and minimum of the periastron variation (also known as the heartbeat event).
Current usage metrics show cumulative count of Article Views (full-text article views including HTML views, PDF and ePub downloads, according to the available data) and Abstracts Views on Vision4Press platform.
Data correspond to usage on the plateform after 2015. The current usage metrics is available 48-96 hours after online publication and is updated daily on week days.
Initial download of the metrics may take a while.