Fig. 15
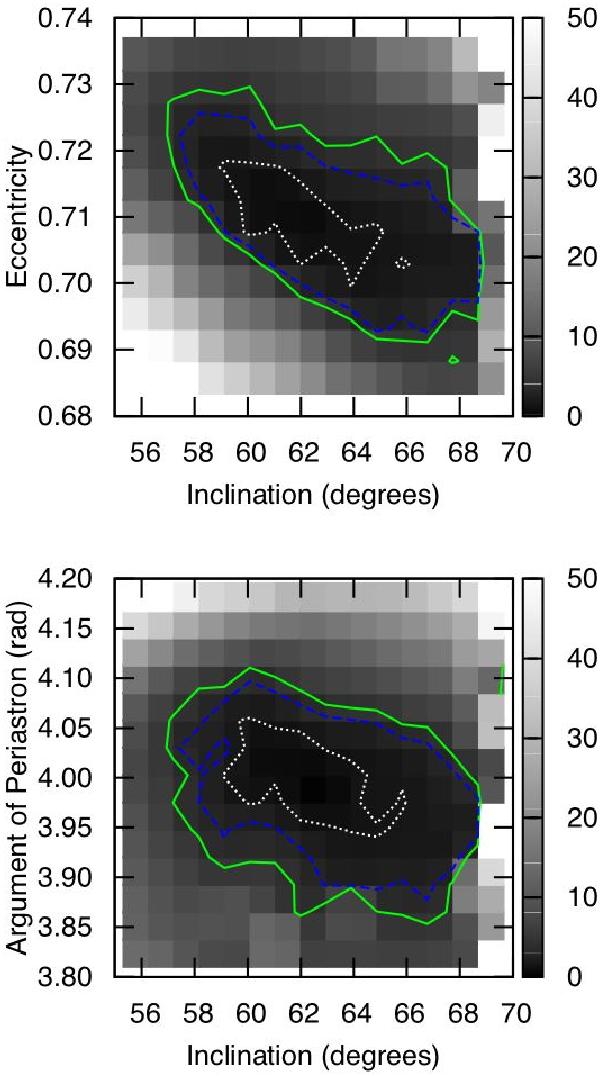
Density maps of the Monte Carlo simulations of the inclination vs. eccentricity (upper panel) and the inclination vs. argument of periastron (lower panel) for the non-beaming case. The grey scale depicts the χ2values mapped across the grid. The colour bar depicts the grey scale pertaining to the different values of χ2. The contours (from inner to outer) denote the 1σ (dotted white line), 2σ (dashed blue line) and 3σ (solid green line) confidence intervals. The uncertainties for the inclination, argument of periastron and eccentricity were determined using the 1σ confidence contours displayed.
Current usage metrics show cumulative count of Article Views (full-text article views including HTML views, PDF and ePub downloads, according to the available data) and Abstracts Views on Vision4Press platform.
Data correspond to usage on the plateform after 2015. The current usage metrics is available 48-96 hours after online publication and is updated daily on week days.
Initial download of the metrics may take a while.