Fig. 6
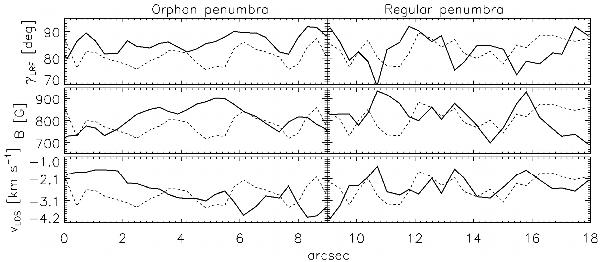
Variations of γLRF, B, and vLOS along the cuts marked with white lines in Fig. 3. The solid and dashed lines show the atmospheric parameters and the continuum intensity, respectively. For display purposes, we changed the polarity of the field along the cut through the filaments of the regular penumbra and also increased γLRF by 10° and vLOS by 1 km s-1 there. The range of continuum intensities used to draw the dashed lines is the same for orphan and regular penumbrae.
Current usage metrics show cumulative count of Article Views (full-text article views including HTML views, PDF and ePub downloads, according to the available data) and Abstracts Views on Vision4Press platform.
Data correspond to usage on the plateform after 2015. The current usage metrics is available 48-96 hours after online publication and is updated daily on week days.
Initial download of the metrics may take a while.