Fig. 3
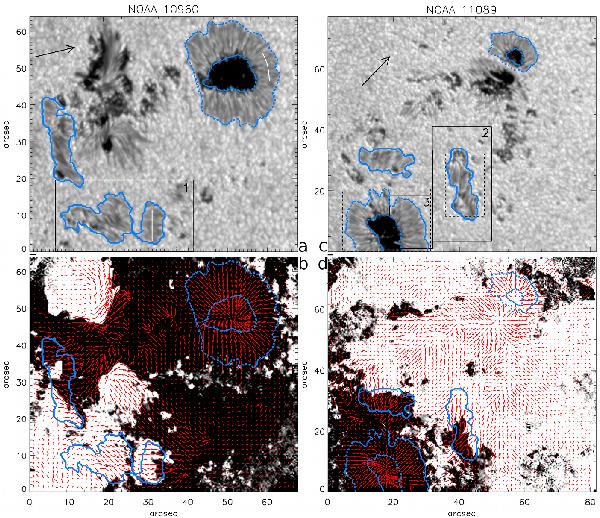
Continuum intensity maps showing an active region NOAA 10960 on 4 June 2007 around 13 UT a) and NOAA 11089 on 22 July 2010 around 22:30 UT c) at heliocentric angles of 47° and 43°, respectively. North is up and east to the left. Maps of the vertical component of the magnetic field in the LRF saturated at ±25 G are shown in b) and d). The red arrows mark the strength and orientation of the horizontal component of the magnetic field. The length of the thick lines above the maps b) and d) correspond to 1000 G. The solid and dashed contours encircle the orphan and regular penumbrae, respectively. The boxes indicated by solid black lines mark the areas displayed in Figs. 4 and 5. The boxes indicated by dashed black lines mark the areas displayed in Fig. 8. The white lines in a) mark the positions of cuts displayed in Fig. 6.
Current usage metrics show cumulative count of Article Views (full-text article views including HTML views, PDF and ePub downloads, according to the available data) and Abstracts Views on Vision4Press platform.
Data correspond to usage on the plateform after 2015. The current usage metrics is available 48-96 hours after online publication and is updated daily on week days.
Initial download of the metrics may take a while.