Free Access
Fig. 15
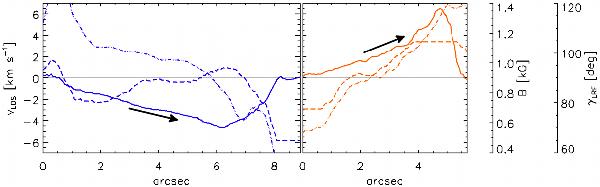
Variation of magnetic field strength (dashed lines), LRF inclination (dash-dotted lines), and LOS velocity (solid lines) along the filaments marked by orange and blue lines in Fig. 14. Distances are measured from the filament heads (circles in Fig. 14). The black arrows show the direction of the flows along the cuts.
Current usage metrics show cumulative count of Article Views (full-text article views including HTML views, PDF and ePub downloads, according to the available data) and Abstracts Views on Vision4Press platform.
Data correspond to usage on the plateform after 2015. The current usage metrics is available 48-96 hours after online publication and is updated daily on week days.
Initial download of the metrics may take a while.