Fig. 13
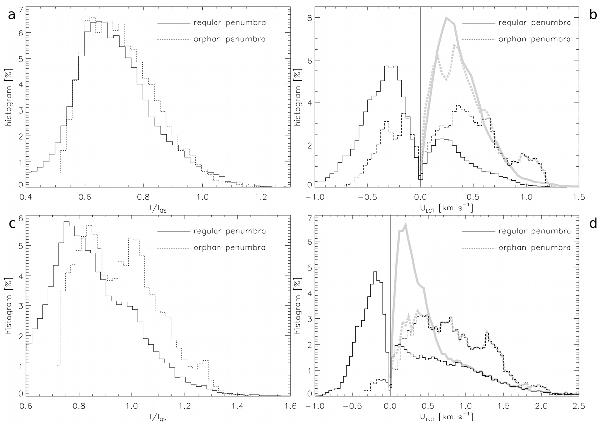
a) and b) Histograms of the G-band intensity and apparent horizontal velocities of pixels encircled by contours in Fig. 12a. c) and d) Histograms of the Ca ii H intensity and apparent horizontal velocities of pixels encircled by contours in Fig. 12c. Inward motions have negative sign. The thick grey lines in the histograms of apparent horizontal velocities show the distribution of | ULCT |.
Current usage metrics show cumulative count of Article Views (full-text article views including HTML views, PDF and ePub downloads, according to the available data) and Abstracts Views on Vision4Press platform.
Data correspond to usage on the plateform after 2015. The current usage metrics is available 48-96 hours after online publication and is updated daily on week days.
Initial download of the metrics may take a while.