Fig. 12
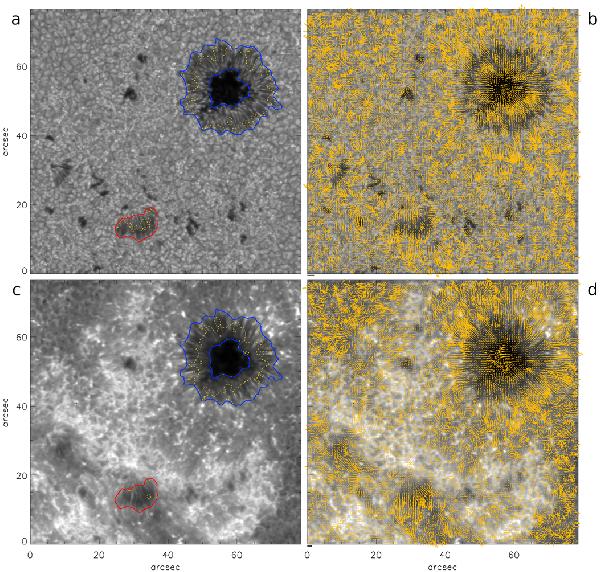
G-band and Ca ii H filtergrams of active region NOAA 10960 taken at 15:51 UT on 6 June 2007 a), c). The red and blue contours mark the position of orphan and regular penumbrae, respectively, and are based on smoothed G-band intensity images. The arrows show the apparent horizontal motions of structures in the G-band b) and Ca ii H d) filtergrams. The thick lines below the beginning of the x-axes correspond to 1 km s-1. The yellow dashed contours in a) and c) mark the boundary between the inward and outward apparent motions seen in b) and d), respectively.
Current usage metrics show cumulative count of Article Views (full-text article views including HTML views, PDF and ePub downloads, according to the available data) and Abstracts Views on Vision4Press platform.
Data correspond to usage on the plateform after 2015. The current usage metrics is available 48-96 hours after online publication and is updated daily on week days.
Initial download of the metrics may take a while.