Fig. 11
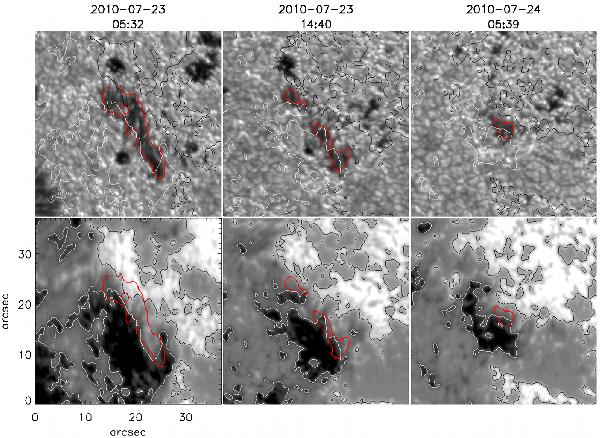
Co-spatial and co-temporal G-band images and Na i D V/I magnetograms showing the temporal evolution of the orphan penumbra observed in active region NOAA 11089 (area No. 2 in Fig. 3c). The red contours mark the orphan penumbra location. The black and white contours show the patches of positive and negative polarity, respectively. The temporal evolution of the V/I magnetograms (lower panels) is available in the online edition. (Online movie)
Current usage metrics show cumulative count of Article Views (full-text article views including HTML views, PDF and ePub downloads, according to the available data) and Abstracts Views on Vision4Press platform.
Data correspond to usage on the plateform after 2015. The current usage metrics is available 48-96 hours after online publication and is updated daily on week days.
Initial download of the metrics may take a while.