Fig. 10
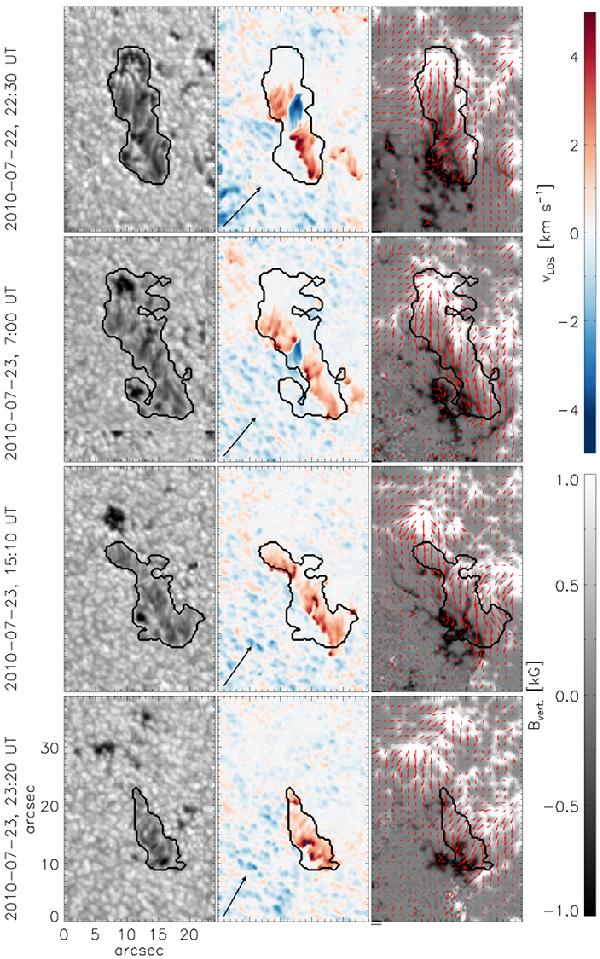
Temporal evolution of the orphan penumbra observed in NOAA 11089 (area No. 2 in Fig. 3c). From left to right, we show continuum intensity maps, LOS velocity maps, and maps of the vertical component of the magnetic field with red arrows indicating the strength and orientation of the horizontal component. The black arrows in the LOS velocity maps point towards the disc centre.
Current usage metrics show cumulative count of Article Views (full-text article views including HTML views, PDF and ePub downloads, according to the available data) and Abstracts Views on Vision4Press platform.
Data correspond to usage on the plateform after 2015. The current usage metrics is available 48-96 hours after online publication and is updated daily on week days.
Initial download of the metrics may take a while.