Fig. 7
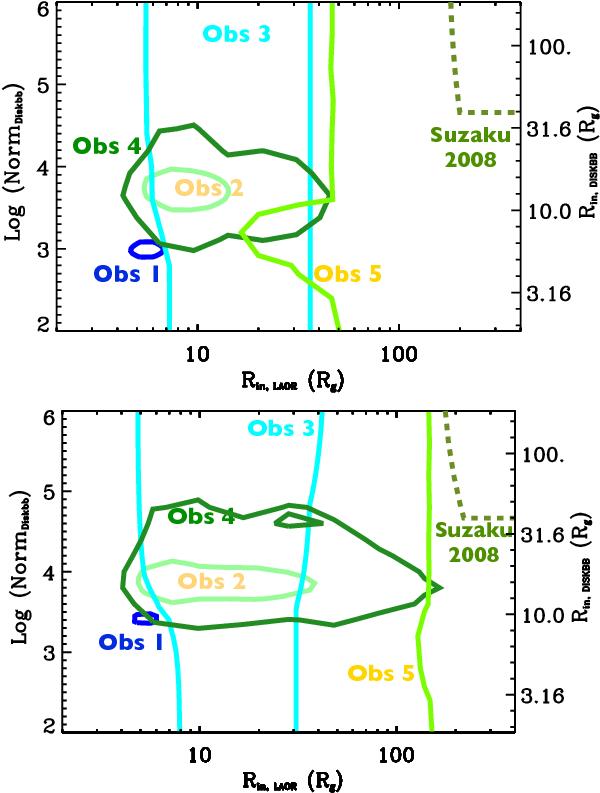
Contour plots of the disk normalization (left scale) and the corresponding disk inner radius Rin,diskbb (right scale) vs. the disk inner radius Rin,laor deduced from the laor profile. The five XIS spectra have been fitted with a diskbb + laor model and a power law (top) or a comptonization model comptt (bottom) for the continuum. We assume a disk inclination of 20 deg., a distance of 8 kpc and a black hole mass of 10 solar masses. For OBS5, the 90% confidence area is to the left of the light green line. The dashed contour corresponds to the Suzaku observation of 2008 (Tomsick et al. 2009).
Current usage metrics show cumulative count of Article Views (full-text article views including HTML views, PDF and ePub downloads, according to the available data) and Abstracts Views on Vision4Press platform.
Data correspond to usage on the plateform after 2015. The current usage metrics is available 48-96 hours after online publication and is updated daily on week days.
Initial download of the metrics may take a while.