Free Access
Fig. 4
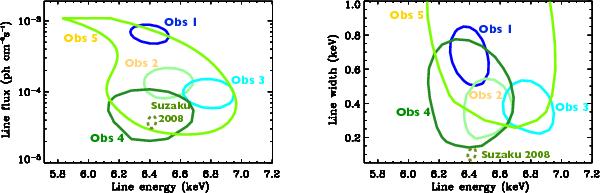
90% contour plots line flux vs. line energy (left) and line width vs. line energy (right) from the best-fits of the five XIS spectra with a power law + gaussian model in the 3−10 keV energy range. The dashed contour corresponds to the Suzaku observation of 2008 (Tomsick et al. 2009).
This figure is made of several images, please see below:
Current usage metrics show cumulative count of Article Views (full-text article views including HTML views, PDF and ePub downloads, according to the available data) and Abstracts Views on Vision4Press platform.
Data correspond to usage on the plateform after 2015. The current usage metrics is available 48-96 hours after online publication and is updated daily on week days.
Initial download of the metrics may take a while.