Fig. 2
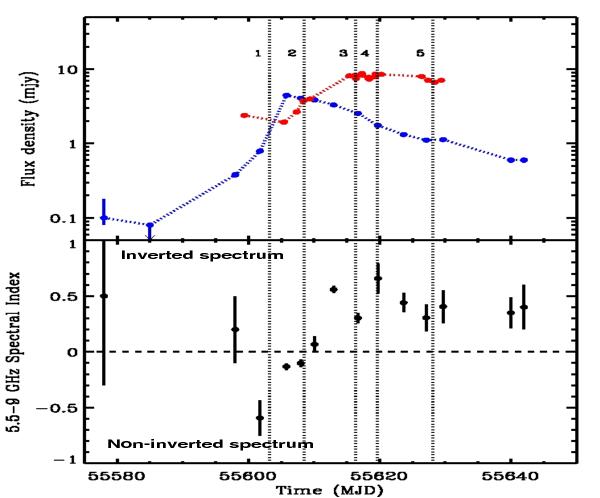
Top: 5.5 GHz (blue) and H band (red) light curves. Bottom: light curve of the 5.5−9 GHz spectral index. A positive spectral index corresponds to an inverted spectrum that is generally characteristic of an optically thick synchrotron emission from a stratified jet (e.g., Blandford & Königl 1979). The dates of the five Suzaku observations are indicated by the vertical dotted lines (data from Corbel et al. 2013).
Current usage metrics show cumulative count of Article Views (full-text article views including HTML views, PDF and ePub downloads, according to the available data) and Abstracts Views on Vision4Press platform.
Data correspond to usage on the plateform after 2015. The current usage metrics is available 48-96 hours after online publication and is updated daily on week days.
Initial download of the metrics may take a while.