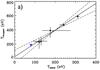
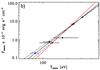
Fig. 11
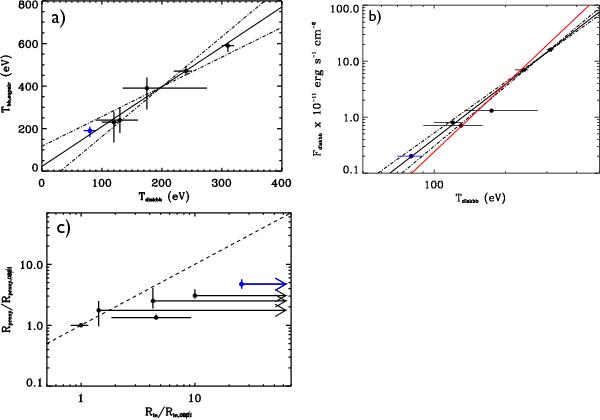
a) Best-fit diskbb temperature vs eqpair soft photon temperature. The solid line is the linear best fit. It has a slope of 1.9. The dot-dashed lines correspond to the 1σ error on the slope i.e. 1.9 ± 0.5. b) Flux of the diskbb component versus diskbb temperature. The solid black line corresponds to the log-log linear best fit  and the dot-dashed lines to the 1σ. The solid red line corresponds to the best fit assuming a
  law. c) Plot of Rproxy (see Sect. 4) versus the disk inner radius Rin deduced from our fits (reported in Table 4) and which assumes the X-ray luminosity ∝ Ṁα with α = 2.5(the results are very similar for α = 2 or 3). The dashed line corresponds to Rproxy = Rin. The blue points in each figure correspond to the 2008 Suzaku observation.
Current usage metrics show cumulative count of Article Views (full-text article views including HTML views, PDF and ePub downloads, according to the available data) and Abstracts Views on Vision4Press platform.
Data correspond to usage on the plateform after 2015. The current usage metrics is available 48-96 hours after online publication and is updated daily on week days.
Initial download of the metrics may take a while.