Free Access
Fig. 5
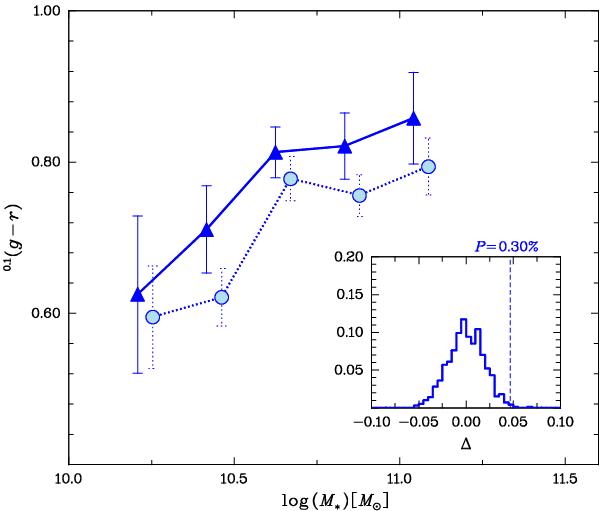
0.1(g − r) as a function of stellar mass for LT galaxies. Points represent the median in each bin. Vertical error bars are obtained by using the bootstrap resampling technique. The inset shows the confidence test (see text). Symbol types as in Fig. 3.
Current usage metrics show cumulative count of Article Views (full-text article views including HTML views, PDF and ePub downloads, according to the available data) and Abstracts Views on Vision4Press platform.
Data correspond to usage on the plateform after 2015. The current usage metrics is available 48-96 hours after online publication and is updated daily on week days.
Initial download of the metrics may take a while.