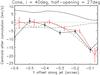
Fig. 9

Top panel: predicted centroid velocities in units of the total gas speed for a PV along the jet, for the same two models shown in Fig. 8: cone (in red) and half-sphere (in black). The bottom solid curves are for a pure outward parallel flow (cosα = 0), top curves for a pure outward perpendicular flow (cosα = 1), and middle curves for an intermediate situation (V∥/V⊥ = 1.3, cosα = 0.6). Bottom panel: observed H2 1–0 S(1) centroid velocities in a PV along the jet axis (symbols with error bars, from Fig. 4) compared with predictions for the conical model. Dashed curve: V⊥ = 20 km s-1 and cosα = 0.6; dash-dotted curve: V⊥ = −5 km s-1 and V∥ = 0; solid curve: V⊥ = + 10 km s-1 and V∥ = 0.

Current usage metrics show cumulative count of Article Views (full-text article views including HTML views, PDF and ePub downloads, according to the available data) and Abstracts Views on Vision4Press platform.
Data correspond to usage on the plateform after 2015. The current usage metrics is available 48-96 hours after online publication and is updated daily on week days.
Initial download of the metrics may take a while.