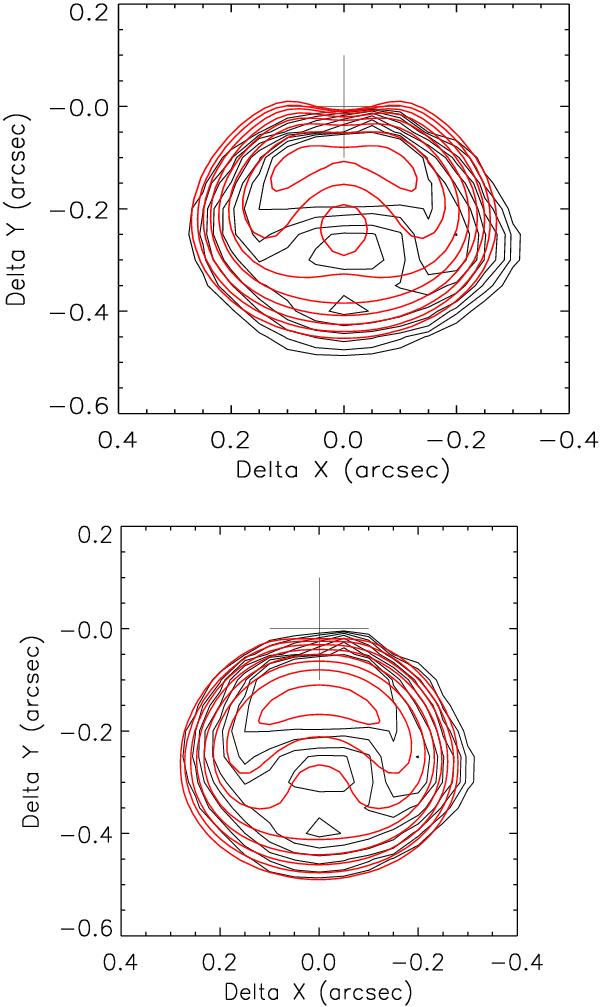
Fig. 8

Predicted emission maps for toy models (black contours) convolved by a Gaussian of  FWHM, superimposed on the observed deconvolved H2 1–0 S(1) map from Fig. 1 (red contours). Top: hollow cone viewed 40° from pole-on with radius 60 AU and semi-opening angle 27°. Bottom: hollow half-sphere viewed 45° from pole-on, with radius 28 AU and center projected at 40 AU along the blue jet. All contours increase by factors of
  . The PSF of the spectrum at (0, 0) was subtracted in all cases.
Current usage metrics show cumulative count of Article Views (full-text article views including HTML views, PDF and ePub downloads, according to the available data) and Abstracts Views on Vision4Press platform.
Data correspond to usage on the plateform after 2015. The current usage metrics is available 48-96 hours after online publication and is updated daily on week days.
Initial download of the metrics may take a while.


