Fig. 7
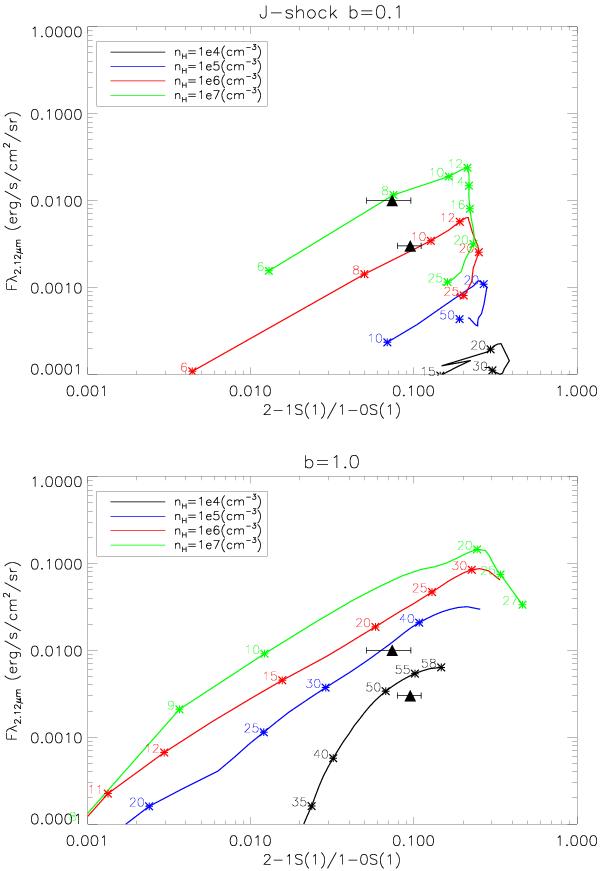
H2 surface brightness in the 1–0 S(1) line against the v = 2 − 1 S(1)/v = 1–0 S(1) ratio as observed in the DG Tau blue lobe (lower triangle: center of blue lobe, upper triangle: inner peak) and as predicted for planar shock models viewed face-on from Kristensen et al. (2008) (colour curves). The error bars on observed surface brightness are smaller than the symbol size, while the difference between the two symbols illustrates the maximum uncertainty due to projection/limb-brightening effects. Top panel: planar J-shocks with b = 0.1. Bottom panel: C-shocks with b = 1. Each model curve corresponds to a different value of the preshock hydrogen nucleus density nH, increasing from bottom to top. The shock speed Vs increases to the right and some values are marked along the curves to guide the eye. Similar plots for C-shocks with b = 0.5 and b = 10 are shown in Appendix B. Note the narrow range of shock speeds reproducing the observed 2–1 S(1)/1−0 S(1) ratios.
Current usage metrics show cumulative count of Article Views (full-text article views including HTML views, PDF and ePub downloads, according to the available data) and Abstracts Views on Vision4Press platform.
Data correspond to usage on the plateform after 2015. The current usage metrics is available 48-96 hours after online publication and is updated daily on week days.
Initial download of the metrics may take a while.