Fig. 2
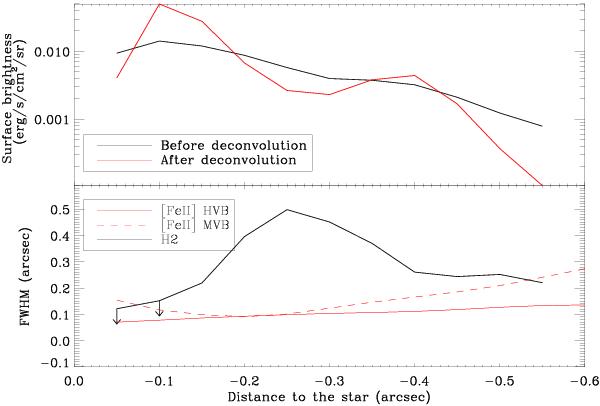
Top panel: cut of H2 1–0 S(1) surface brightness along the blue jet axis, before and after deconvolution by the PSF. The drop in flux inside  results from our continuum subtraction procedure. Deconvoled peak values should be viewed with caution. Bottom panel: transverse FWHM of H2 1–0 S(1) emission in the blue lobe as a function of the distance to the star, as measured in the deconvolved image. In red, we superimpose the FWHM of [Fe II]1.64 μm at the same epoch in two velocity ranges: MVB (–160 km s-1 < V < + 50 km s-1) and HVB (V < − 160 km s-1), taken from Paper I.
Current usage metrics show cumulative count of Article Views (full-text article views including HTML views, PDF and ePub downloads, according to the available data) and Abstracts Views on Vision4Press platform.
Data correspond to usage on the plateform after 2015. The current usage metrics is available 48-96 hours after online publication and is updated daily on week days.
Initial download of the metrics may take a while.