Fig. A.1
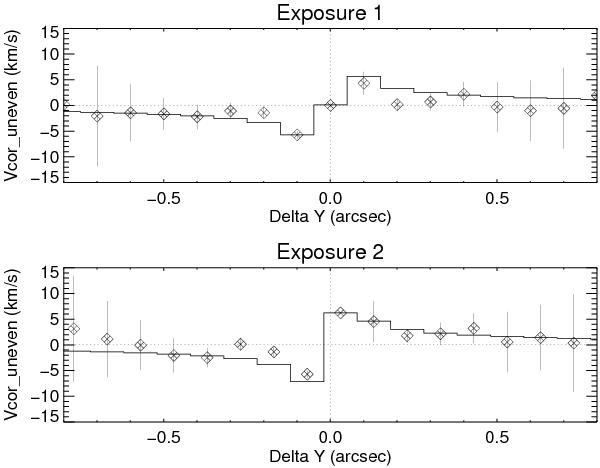
Velocity corrections for uneven slit illumination in PV diagrams along the jet averaged  across the jet axis for exposure 1 (top) and exposure 2 (bottom). Black histograms plot the theoretical correction computed for a 2D brightness distribution fitted by a Moffat function. Symbols with error bars show empirical shifts obtained from cross-correlation of telluric absorption features against the reference spectrum (at Y = 0″ in exposure 1 and
  in exposure 2). To ease comparison with the theoretical model, they are shifted vertically to match the model at the reference spectrum position.
Current usage metrics show cumulative count of Article Views (full-text article views including HTML views, PDF and ePub downloads, according to the available data) and Abstracts Views on Vision4Press platform.
Data correspond to usage on the plateform after 2015. The current usage metrics is available 48-96 hours after online publication and is updated daily on week days.
Initial download of the metrics may take a while.