Fig. 1
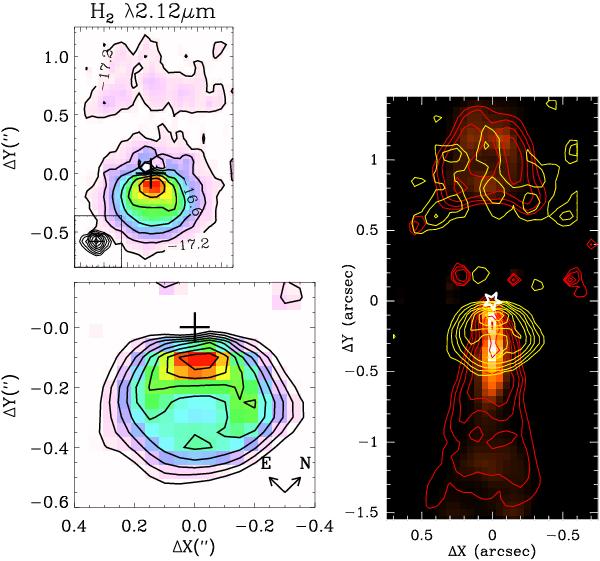
Top left: raw continuum-subtracted map of H2 1–0 S(1) line emission in DG Tau. Contours start at 2.7 × 10⁻⁴ erg s-1 cm-2 sr-1 and increase by factors of 2. The cross denotes the centroid of the continuum image (shown as an insert). Bottom left: H2 1–0 S(1) map after deconvolution by the continuum image. The lack of H2 emission at the central position results from our continuum subtraction procedure. Right panel: deconvolved H2 1–0 S(1) image (yellow contours) superimposed on the deconvolved channel maps of [Fe II]1.64 μm obtained at the same epoch and resolution by Agra-Amboage et al. (2011), in two velocity ranges: MV (red contours; –160 km s-1 < V < 120 km s-1) and HV (background colour image; V < − 160 km s-1 and V > 120 km s-1).


Current usage metrics show cumulative count of Article Views (full-text article views including HTML views, PDF and ePub downloads, according to the available data) and Abstracts Views on Vision4Press platform.
Data correspond to usage on the plateform after 2015. The current usage metrics is available 48-96 hours after online publication and is updated daily on week days.
Initial download of the metrics may take a while.