Fig. 5
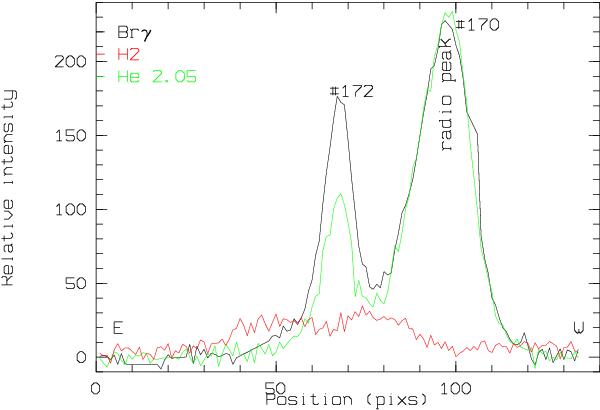
The intensity profiles of near-IR emission lines from a NACO long-slit spectrum in east-west direction (left-right) crossing stars 170 (component A) and 172 (component C). Star 173 (component B) does not appear because it is not situated on the E-W cross-cut. The red line represents the H2 2.121 μm emission line. The green line represents the He i 2.113 μm and the black line the Brγ emission line. The position of the radio source B0046-7333 is indicated. The plot extension is 7.̋07 (1 pix = 0.̋05273). (See electronic edition of the journal for a color version of this figure.)
Current usage metrics show cumulative count of Article Views (full-text article views including HTML views, PDF and ePub downloads, according to the available data) and Abstracts Views on Vision4Press platform.
Data correspond to usage on the plateform after 2015. The current usage metrics is available 48-96 hours after online publication and is updated daily on week days.
Initial download of the metrics may take a while.