Fig. 10
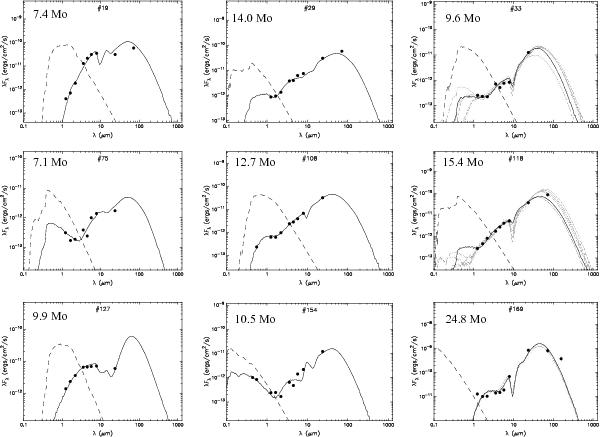
Spectral density distribution of nine YSOs obtained using the YSO models of Robitaille et al. (2006). Filled circles are the flux values converted from magnitudes listed in Table 2. The thin black line represents the best fitting SED, and the gray lines show all models that also fit the data well (defined by  , where χ2 is the value per data point). The dashed line represents the stellar photosphere model (corrected for the foreground extinction). The derived masses are indicated; see Table 6 for other parameters.
Current usage metrics show cumulative count of Article Views (full-text article views including HTML views, PDF and ePub downloads, according to the available data) and Abstracts Views on Vision4Press platform.
Data correspond to usage on the plateform after 2015. The current usage metrics is available 48-96 hours after online publication and is updated daily on week days.
Initial download of the metrics may take a while.