Fig. 1
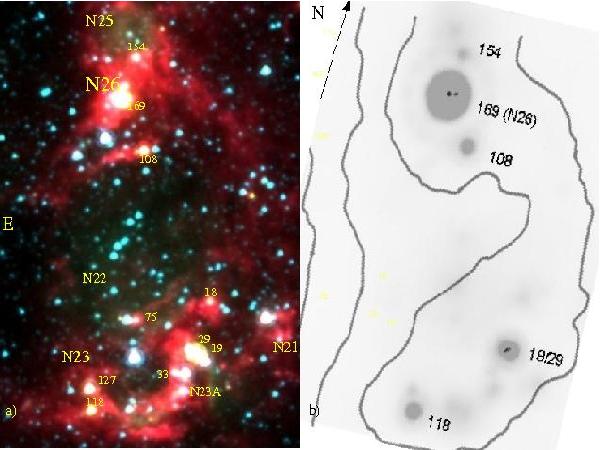
a) False-color composite image of SMCB2-H ii from Spitzer IRAC bands 3.6 μm (blue), 4.5 μm (green), and 8 μm (red). The various H ii regions detected by Henize (1956) in this part of the SMC are labeled, as well as the YSO candidates (Sect. 4.6). The image center is α = 0h48m01 85, δ = −73°16′03.̋75. Total field size 168′′ × 251′′ or 50 × 76 pc. b) The MIPS 24 μm image of the SMCB2-HII region with the CO contours overlaid. The contours outline the molecular cloud SMCB2 (Bot et al. 2010). The bright stars are labeled (see electronic edition of the journal for a color version of this figure).
Current usage metrics show cumulative count of Article Views (full-text article views including HTML views, PDF and ePub downloads, according to the available data) and Abstracts Views on Vision4Press platform.
Data correspond to usage on the plateform after 2015. The current usage metrics is available 48-96 hours after online publication and is updated daily on week days.
Initial download of the metrics may take a while.