Fig. 5
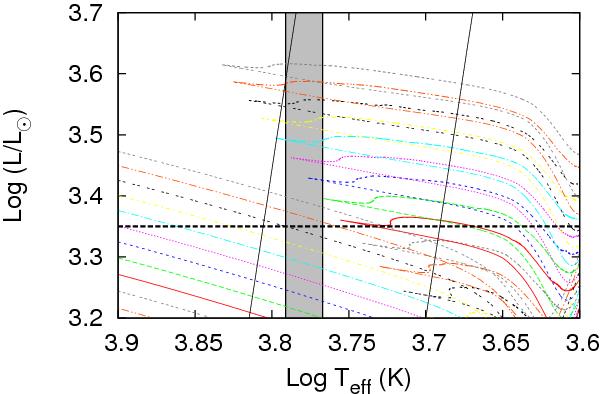
HR diagram showing stellar evolution tracks with zero initial rotation and mass-loss rate, Ṁ = 10-9 M⊙ yr-1, focused on the region of the diagram consistent with the effective temperature of Polaris, Teff = 6015 ± 170 K (Usenko et al., 2005), denoted by the grey box. The diagonal black lines form the boundaries of the Cepheid instability strip, while the horizontal line denotes the likely minimum blue loop luminosity consistent with the effective temperature of Polaris. The brightest blue loop represents an initial stellar mass of 6.5 M⊙ (grey dashed), while the dimmest blue loop shown is for a 5.4 M⊙ model (black dashes). Each model differs by ΔM = 0.1 M⊙.
Current usage metrics show cumulative count of Article Views (full-text article views including HTML views, PDF and ePub downloads, according to the available data) and Abstracts Views on Vision4Press platform.
Data correspond to usage on the plateform after 2015. The current usage metrics is available 48-96 hours after online publication and is updated daily on week days.
Initial download of the metrics may take a while.