Fig. 1
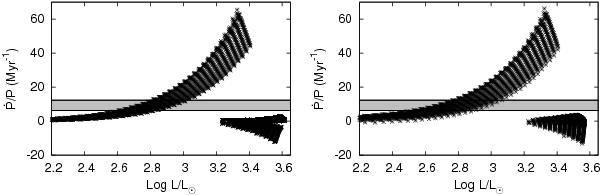
Predicted rates of period change for stars crossing the Cepheid instability strip assuming different prescriptions for Cepheid mass loss: Ṁ = 10-9 M⊙ yr-1 (left) and 10-6 M⊙ yr-1 (right), the results for the other two cases are nearly indistinguishable. The grey band refers to the measured rate of period change for Polaris (Neilson et al., 2012a).
Current usage metrics show cumulative count of Article Views (full-text article views including HTML views, PDF and ePub downloads, according to the available data) and Abstracts Views on Vision4Press platform.
Data correspond to usage on the plateform after 2015. The current usage metrics is available 48-96 hours after online publication and is updated daily on week days.
Initial download of the metrics may take a while.