Free Access
Fig. 2
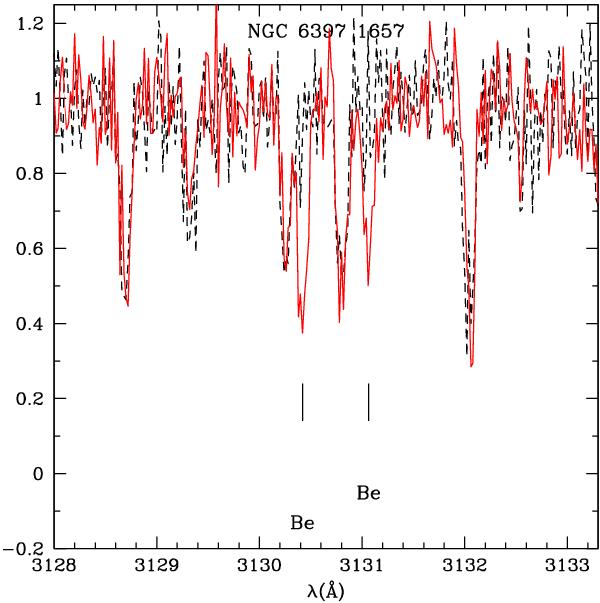
Be-lines in #1657. The observed spectrum is shown as black, dashed line. The red line is a synthetic spectrum with Be/H = −11.5, to which noise has been added. Both Be lines are not detected and only a conservative upper limit could be set at log (Be/H) = −12.2 .
Current usage metrics show cumulative count of Article Views (full-text article views including HTML views, PDF and ePub downloads, according to the available data) and Abstracts Views on Vision4Press platform.
Data correspond to usage on the plateform after 2015. The current usage metrics is available 48-96 hours after online publication and is updated daily on week days.
Initial download of the metrics may take a while.