Fig. 2
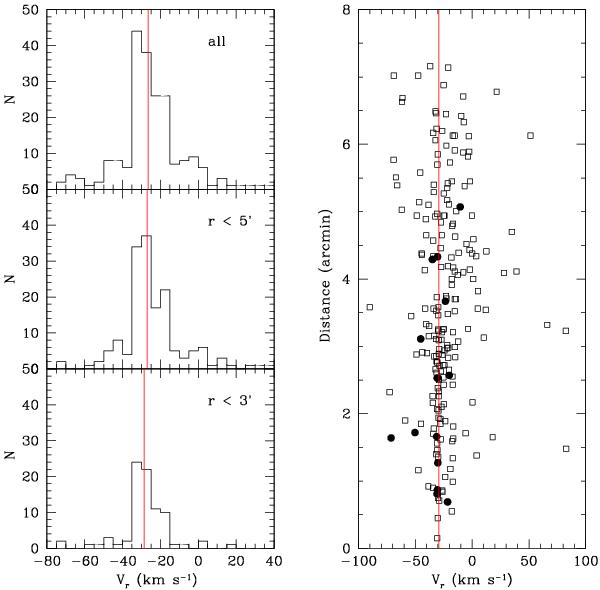
Distribution of radial velocities for stars observed in the field of NGC 4815. Left panel: radial velocity distribution for targets by distance from the cluster center, with the bottom panel showing stars within 3′, the middle panel showing stars within 5′, and the top panel showing the full sample. The solid red line gives the average velocity computed for the distance range plotted in each panel, as explained in the text. Right panel: plot of the distance from the cluster center against radial velocity for all targets. The solid black dots correspond to UVES observations. The open squares correspond to GIRAFFE observations.
Current usage metrics show cumulative count of Article Views (full-text article views including HTML views, PDF and ePub downloads, according to the available data) and Abstracts Views on Vision4Press platform.
Data correspond to usage on the plateform after 2015. The current usage metrics is available 48-96 hours after online publication and is updated daily on week days.
Initial download of the metrics may take a while.