Fig. 21
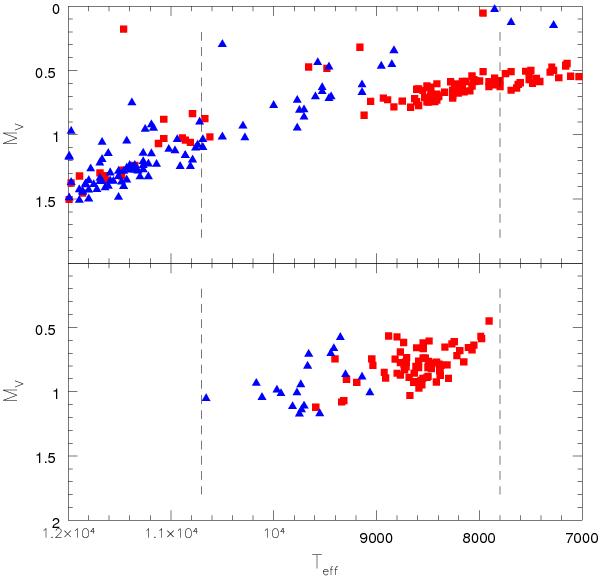
Details of the comparison between synthetic (upper panel) and observed (lower panel) Teff − MV diagram for the horizontal branch of M 22. Red squares are metal-poor stars (in the lower panel, stars of groups 1 and 2); blue triangles are metal-rich stars (in the lower panel, stars of group 3). The region of the HB observed in this paper is within the dashed lines in both panels.
Current usage metrics show cumulative count of Article Views (full-text article views including HTML views, PDF and ePub downloads, according to the available data) and Abstracts Views on Vision4Press platform.
Data correspond to usage on the plateform after 2015. The current usage metrics is available 48-96 hours after online publication and is updated daily on week days.
Initial download of the metrics may take a while.