Fig. 7
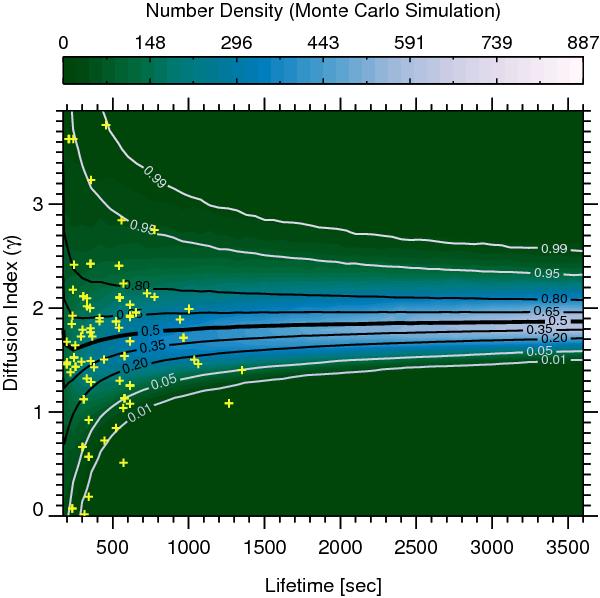
Evolution of the diffusion index histogram with increasing lifetime of the MBPs. The background brightness is a measure of the number density of MBPs with a certain γ obtained from a Monte Carlo simulation. The solid lines indicate the percentiles of the distributions (see main text for details). The observed data points from the Sunrise/SuFI data are overlaid on the simulated plot and are marked by yellow crosses.
Current usage metrics show cumulative count of Article Views (full-text article views including HTML views, PDF and ePub downloads, according to the available data) and Abstracts Views on Vision4Press platform.
Data correspond to usage on the plateform after 2015. The current usage metrics is available 48-96 hours after online publication and is updated daily on week days.
Initial download of the metrics may take a while.