Fig. 5
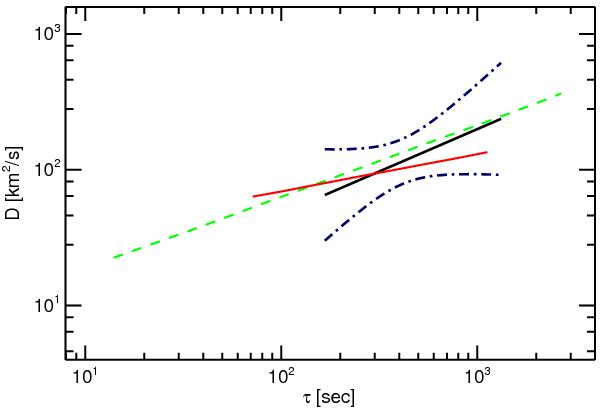
Log-log plot of diffusion coefficients (D) as a function of timescale (τ). Black solid line: A linear fit to the data points determined from trajectories of the Sunrise Ca ii H MBPs. The 95% confidence bands to the fit are overplotted as dot-dashed lines. For comparison, similar plots (for quiet-Sun regions) from Lawrence et al. (2001) (red solid line) and Abramenko et al. (2011) (green dashed line) are overlaid.
Current usage metrics show cumulative count of Article Views (full-text article views including HTML views, PDF and ePub downloads, according to the available data) and Abstracts Views on Vision4Press platform.
Data correspond to usage on the plateform after 2015. The current usage metrics is available 48-96 hours after online publication and is updated daily on week days.
Initial download of the metrics may take a while.