Fig. 4
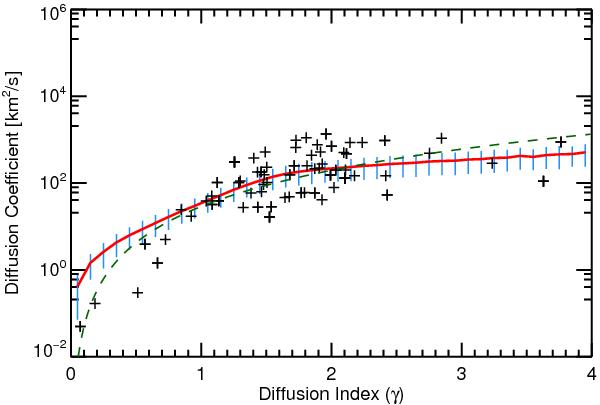
Log-linear plot of diffusion coefficient, D, versus diffusion index, γ. Black crosses indicate the diffusion parameters calculated from trajectories of the Sunrise Ca ii H MBPs. The green, dashed line shows a power-law fit to the data points (see main text). The red solid curve is obtained from a Monte Carlo simulation. Error bars to the simulated values are depicted by blue vertical lines (see Sect. 4.2 for details).
Current usage metrics show cumulative count of Article Views (full-text article views including HTML views, PDF and ePub downloads, according to the available data) and Abstracts Views on Vision4Press platform.
Data correspond to usage on the plateform after 2015. The current usage metrics is available 48-96 hours after online publication and is updated daily on week days.
Initial download of the metrics may take a while.