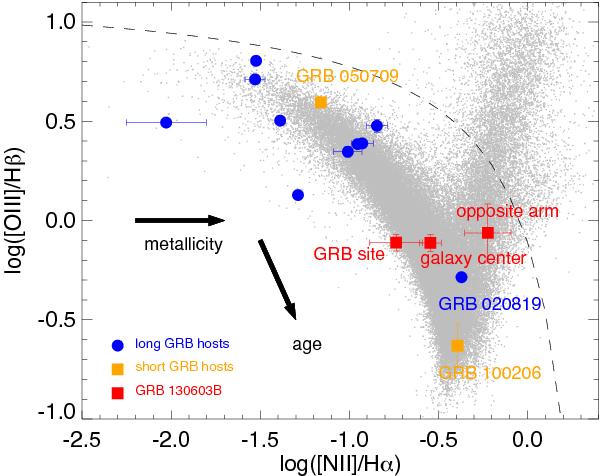
Fig. 9

BPT diagram using [N ii]/Hα and [O iii]/Hβ in different parts of the short burst host as well as a number of other published other long (dots) and short (squares) GRB hosts (data from the GHostS database: http://www.grbhosts.org, see text). Grey dots are galaxies from the SDSS DR9 with a S/N or at least 10 in all emission lines used. The dashed line represents the separation between normal H ii regions and AGN dominated emission. Evolution models (e.g. Dopita et al. 2006) roughly indicate increasing metallicity and age as indicated by the arrows.
Current usage metrics show cumulative count of Article Views (full-text article views including HTML views, PDF and ePub downloads, according to the available data) and Abstracts Views on Vision4Press platform.
Data correspond to usage on the plateform after 2015. The current usage metrics is available 48-96 hours after online publication and is updated daily on week days.
Initial download of the metrics may take a while.


