Fig. 8
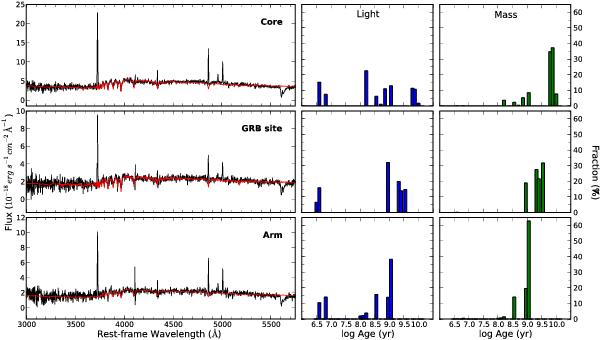
Stellar population fitting of spectra from three different parts of the host galaxy (using the late GTC data): Top panel: galaxy core, middle panel: GRB site, bottom panel: opposite side of the galaxy. The left panels show the original spectrum and the best fit SP model over plotted (in red), the right panels show the light and the mass fraction of populations with different ages.
Current usage metrics show cumulative count of Article Views (full-text article views including HTML views, PDF and ePub downloads, according to the available data) and Abstracts Views on Vision4Press platform.
Data correspond to usage on the plateform after 2015. The current usage metrics is available 48-96 hours after online publication and is updated daily on week days.
Initial download of the metrics may take a while.