Fig. 4
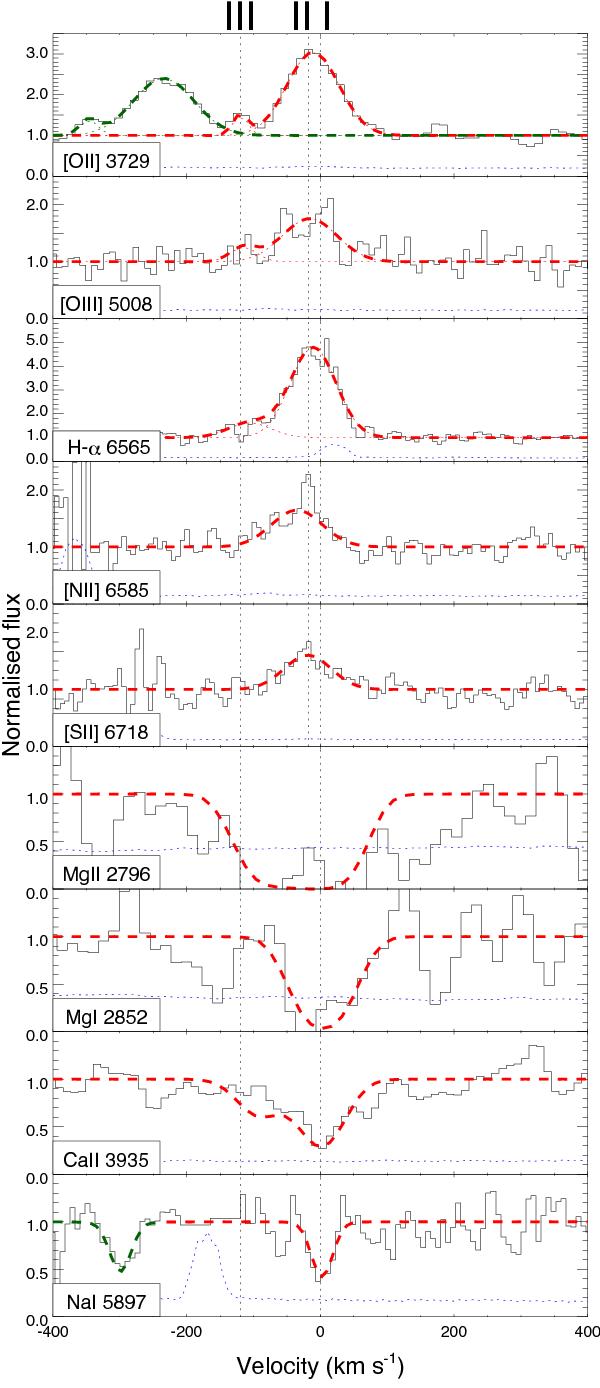
Selection of some of the emission and absorption features in the line of sight of GRB 130603B as observed in the X-shooter afterglow spectrum obtained 8.6 h after the burst onset. Black lines correspond to the normalised spectrum in velocity space, centred at each of the lines, assuming a redshift of 0.3565. Blue dotted lines are the corresponding error spectra. Red dashed lines are Gaussian fits to the emission features and Voigt profile fits to the absorption features. Green dashed lines are used when a further line of the same species, which has also been fitted, lies within the plotted range. Vertical dotted lines mark the position of the different velocity components, where I is the main absorption feature, II is the main emission feature at − 18 km s-1 and III is an additional feature at − 120 km s-1.
Current usage metrics show cumulative count of Article Views (full-text article views including HTML views, PDF and ePub downloads, according to the available data) and Abstracts Views on Vision4Press platform.
Data correspond to usage on the plateform after 2015. The current usage metrics is available 48-96 hours after online publication and is updated daily on week days.
Initial download of the metrics may take a while.