Fig. 3
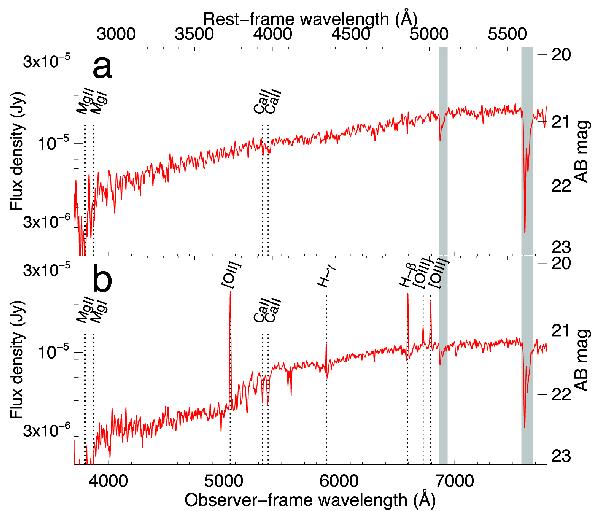
a) Spectrum of the afterglow of GRB 130603B obtained using the OSIRIS instrument on the 10.4 m GTC telescope 7.4 h after the burst onset. The contribution of the host galaxy was subtracted using a second spectrum, that was obtained 5 days later when the afterglow had faded away. Panel b) shows this second spectrum of the host galaxy. Dotted vertical lines indicate the location of some of the absorption and emission features. Grey vertical bands mark the position of strong telluric features.
Current usage metrics show cumulative count of Article Views (full-text article views including HTML views, PDF and ePub downloads, according to the available data) and Abstracts Views on Vision4Press platform.
Data correspond to usage on the plateform after 2015. The current usage metrics is available 48-96 hours after online publication and is updated daily on week days.
Initial download of the metrics may take a while.