Fig. D.1
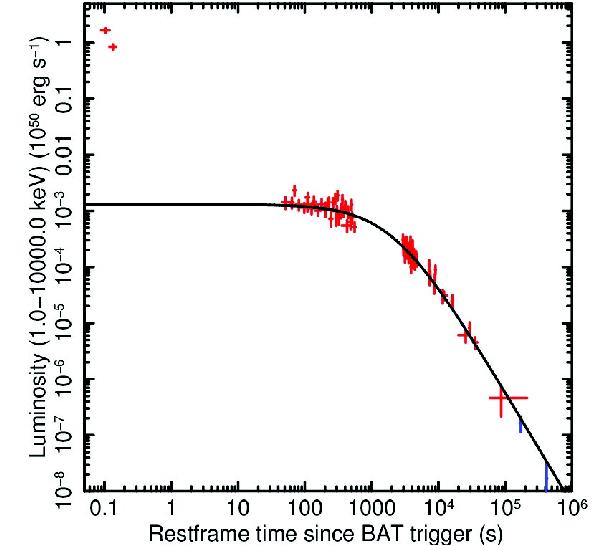
Rest frame 1–10 000 keV light curve for GRB 130603B. The red data are Swift observations, with the first 2 data points being from the BAT observations and the remainder are XRT observations. The blue data are the XMM observations obtained by Fong et al. (2014). The Swift XRT data are fitted using the magnetar model, as described in Rowlinson et al. (2013), shown by the black line.
Current usage metrics show cumulative count of Article Views (full-text article views including HTML views, PDF and ePub downloads, according to the available data) and Abstracts Views on Vision4Press platform.
Data correspond to usage on the plateform after 2015. The current usage metrics is available 48-96 hours after online publication and is updated daily on week days.
Initial download of the metrics may take a while.